

What is short-term seismic hazard?
Short-term seismic hazard refers to the estimation of the probability that ground shaking will occur within a specific time period of days or weeks. Unlike long-term hazard, which is a statistical assessment over decades, short-term hazard provides the likelihood that a seismic event of a given magnitude (distributed according to the well-known Gutenberg-Richter law, see Figure 1) may occur in a particular area, within a limited time interval. In general, short-term estimates are provided in relation to an ongoing seismic activity.It is important to stress that, since earthquakes are extreme events, the probability values estimated for short-term hazard may vary by several orders of magnitude, yet typically remain “small” (less than 1% per day). Nevertheless, when interpreted correctly, they can be extremely useful from an operational standpoint, for example to provide information on events that may follow a strong earthquake that has just occurred.
When is it used?
Short-term seismic hazard assessments can be provided on a daily or weekly basis. For operational purpose, they are generally used in the following situations:
-
After a significant earthquake, to assess the likelihood of subsequent events;
-
During seismic swarms or anomalous sequences;
-
As support for emergency management activities carried out by Civil Protection authorities.
What is it based on?Short-term seismic hazard relies on:
-
Real-time seismic monitoring by the INGV networks;
-
Analysis of the ongoing seismic sequences (magnitude, location, evolution);
-
Probabilistic models that estimate the likelihood of new events.
In Italy, the main tool for short-term seismic hazard assessment is OEF-Italy (Operational Earthquake Forecasting), a system under development by INGV that provides real-time probabilistic estimates. The graphical interface of the OEF system is given in Figure 2, while Figure 3 shows an example of analyzing its forecasting skill, based on the comparison between synthetic and observed data within a given cell located in Central Italy.
How is it communicated?
The INGV, through the CPS and the Osservatorio Nazionale Terremoti, may produce short-term probabilistic assessments that are shared with:
-
The Italian Civil Protection Department, for potential operational actions;
-
Local authorities, to support public-safety decision-making.
What it is NOT
It is important to clarify that short-term seismic hazard:
-
is NOT a deterministic prediction of the next earthquake;
-
does NOT indicate with certainty when or where an earthquake will occur;
-
is a probabilistic tool to support risk management, it is NOT an absolute prediction.
A practical example
Following the 2009 L’Aquila earthquake, or the 2016-2017 Central Italy seismic sequence, short-term hazard assessments were carried out and proved useful in guiding emergency management, public communication, and planning of response activities.
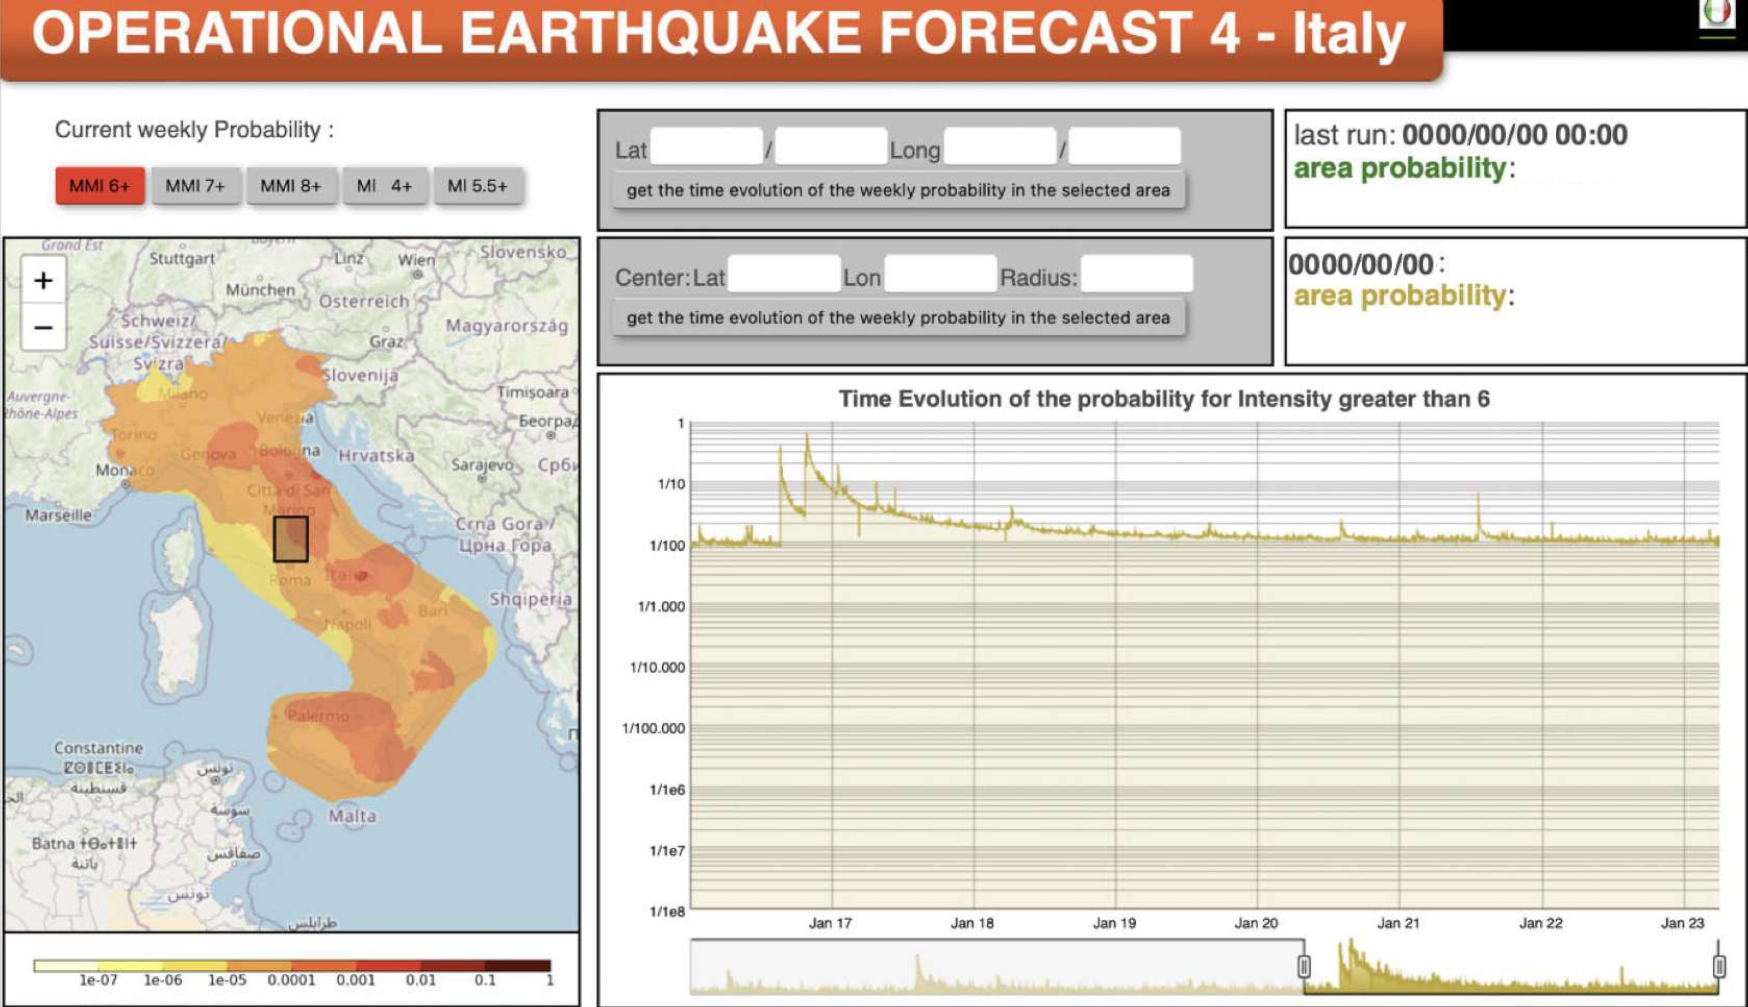
Figure 2 Graphical interface of the OEF-Italy system, example for a small rectangular area in Central Italy (black box in the map). On the left: embedded Leaflet Map of the current weekly probability for the selected area, where we selected the thresholds MMI 6+, 7+ 8+, and ML 4+, 5.5+ as targets. On the right: timeline of the probability history from 2009 to 2021 January (bottom), together with two boxes (top right) showing the probability of the last run, and the probability computed at the date pointed by the cursor along the timeline
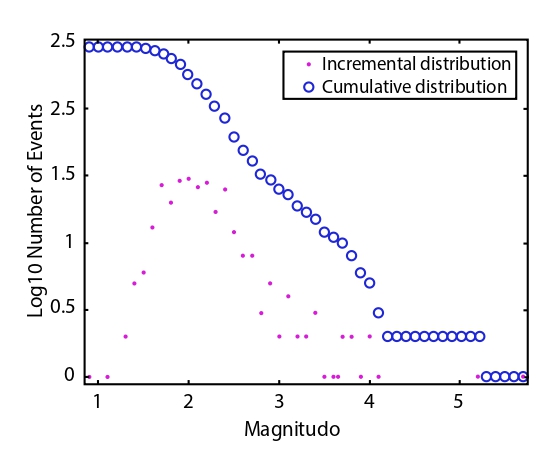
Figure 1 Graphical representation example of the magnitude-frequency Gutenberg-Richter law for seismic events: the purple dots and the blue circles respectively represent the incremental and the cumulative distributions.
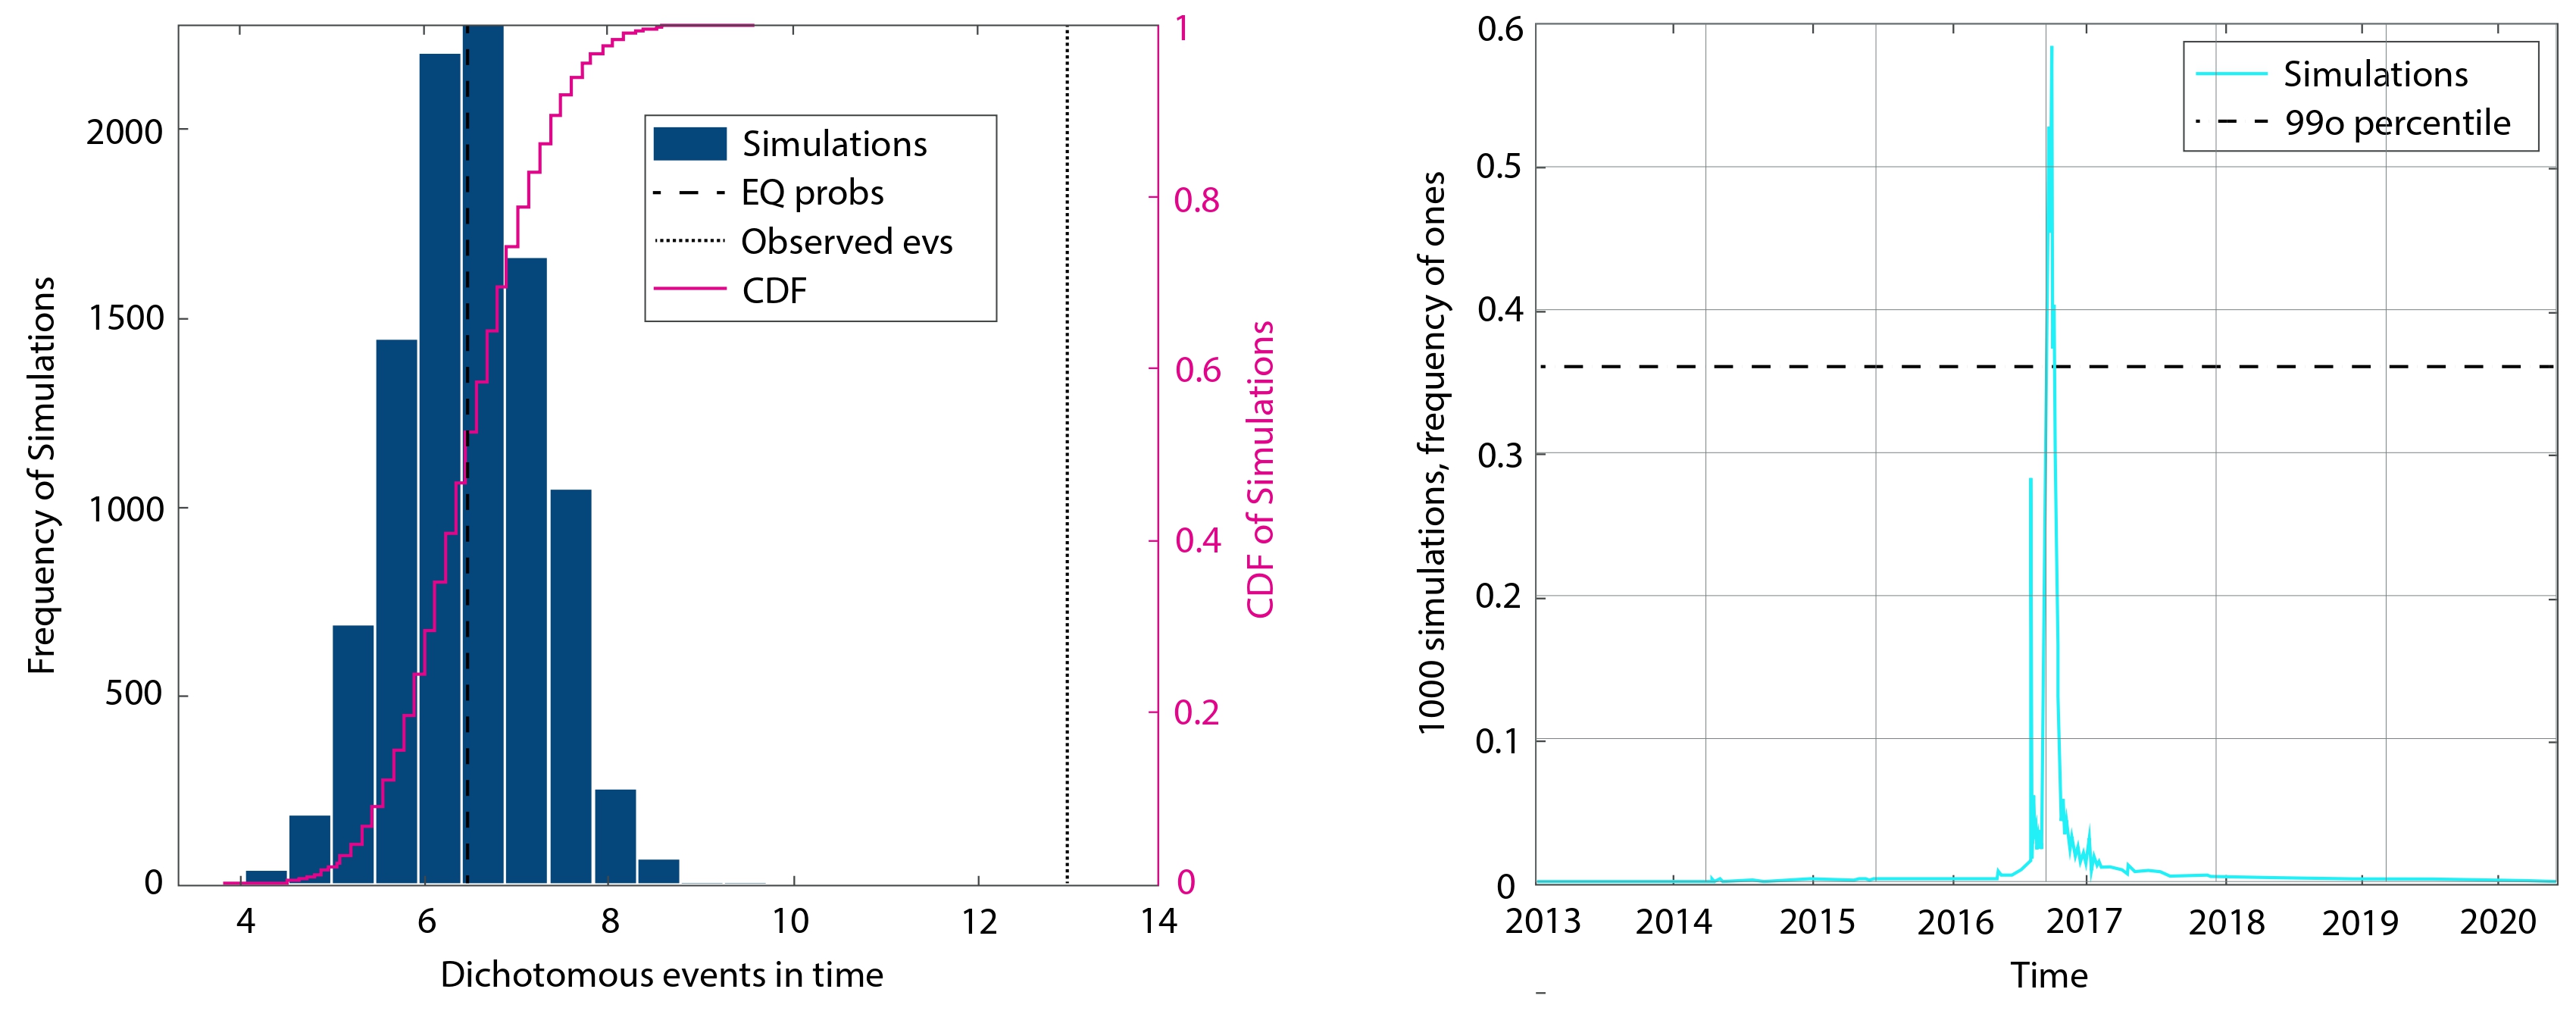 Figure 3 Example of a synthetic analysis focused on one OEF cell in Central Italy. The left-hand column contains the histogram (blue bars) and the CDFs (purple step lines) of the number of temporal OEF bins with at least one target event, among 10 000 synthetic catalogues. The dashed black lines represent the sum of the overall ensemble probabilities within the specific cell, while the dotted black ones represent the number of temporal bins with at least one observed target event. The right-hand column contains the temporal trend of the number of positive observations among the 10 000 simulations (in ciano) and the 99th percentile (horizontal dashed black line)