

The reference seismic hazard model for the Italian territory (MPS04, http://esse1.mi.ingv.it/), which underpins the current national seismic classification and building code, was developed between 2004 and 2006 using the most up-to-date data and knowledge available at the time regarding earthquake catalogues, seismic source models, and ground-motion attenuation relationships (for further information, see http://zonesismiche.mi.ingv.it).
The model was developed using a logic-tree approach to explore alternative choices for key components of the calculation, including the earthquake catalogue, source parameters, and ground-motion attenuation models. For each grid point across the national territory, a weighted median value (50th percentile) was computed from the 16 branches of the logic tree, and the associated uncertainty was quantified by the 16th and 84th percentile values.
The MPS04 model is often represented by the map shown in Figure 1, which displays the values of Peak Ground Acceleration (PGA) with a 10% probability of exceedance in 50 years, for sites on rock or very stiff soil conditions. The Ordinance PCM No. 3519/2006 established this map as the official reference tool for seismic hazard across Italy. However, the model provides much more extensive information, as hazard values were computed for nine different probabilities of exceedance in 50 years (ranging from 81% to 2%, corresponding to return periods from 30 to 2475 years), not only for PGA but also for 10 spectral periods of acceleration response (ranging from 0.1 to 2 seconds).
For each calculation point, the model provides the hazard curve, defining the annual frequency of exceedance for specific PGA values (Figure 2), the uniform hazard spectrum, expressing acceleration values for different spectral periods at various exceedance probabilities in 50 years (Figure 3), and the hazard disaggregation analysis for PGA (Figure 4), identifying the magnitude–distance pairs that contribute most to the seismic hazard at a given site.In total, 99 hazard maps and more than 2,200 parameters were produced for each calculation point. All data are publicly available at http://esse1-gis.mi.ingv.it/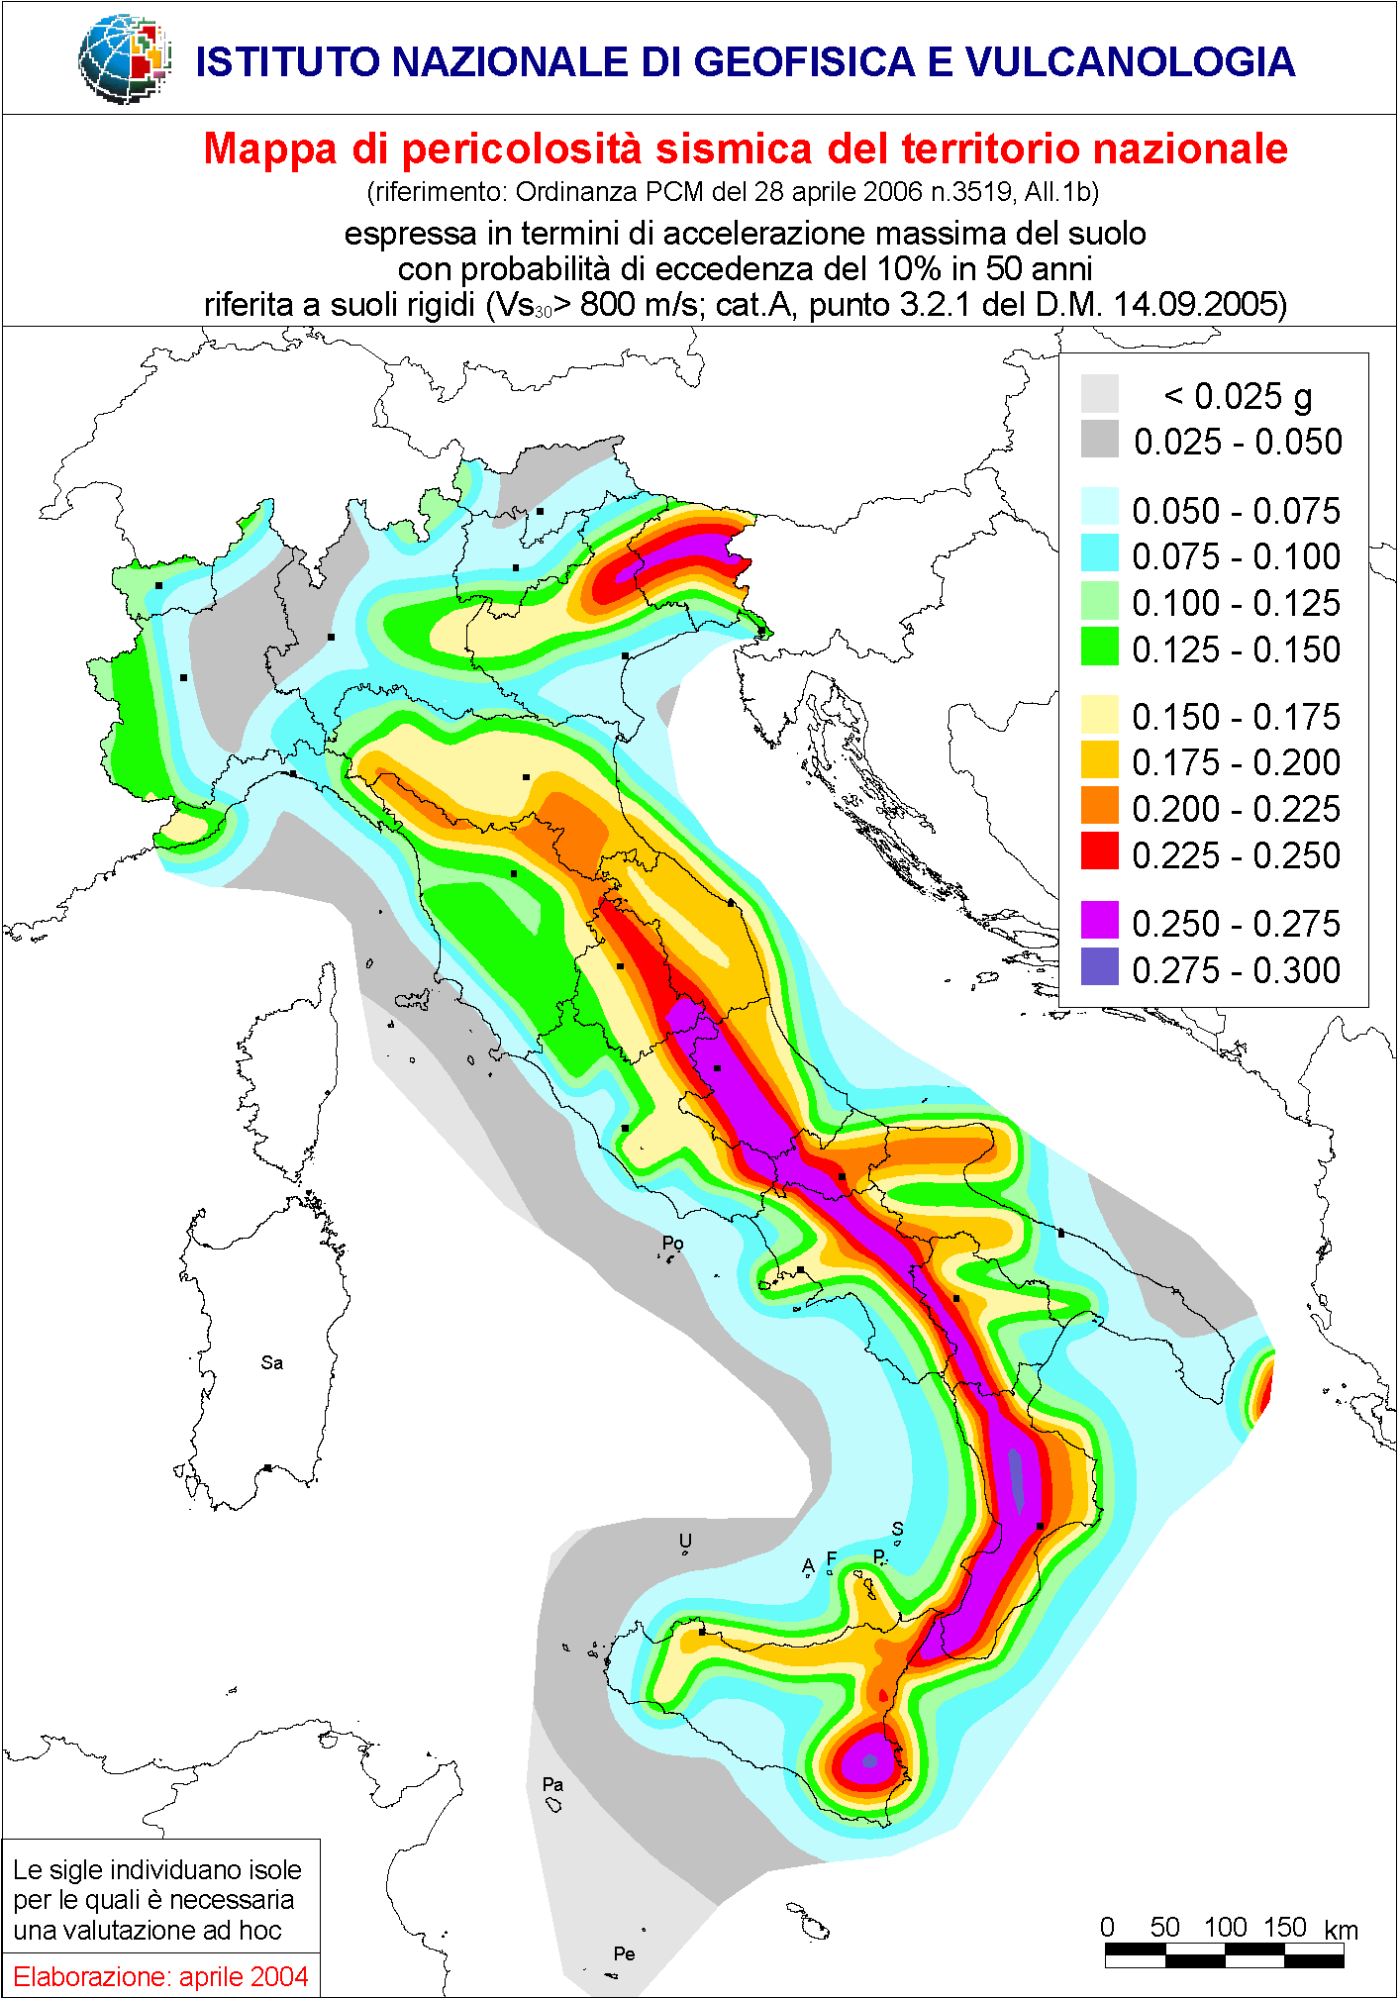 Figure 1 – Seismic hazard map in terms of PGA values (expressed as a fraction of the acceleration of gravity, g) with a 10% probability of exceedance in 50 years ( http://zonesismiche.mi.ingv.it)
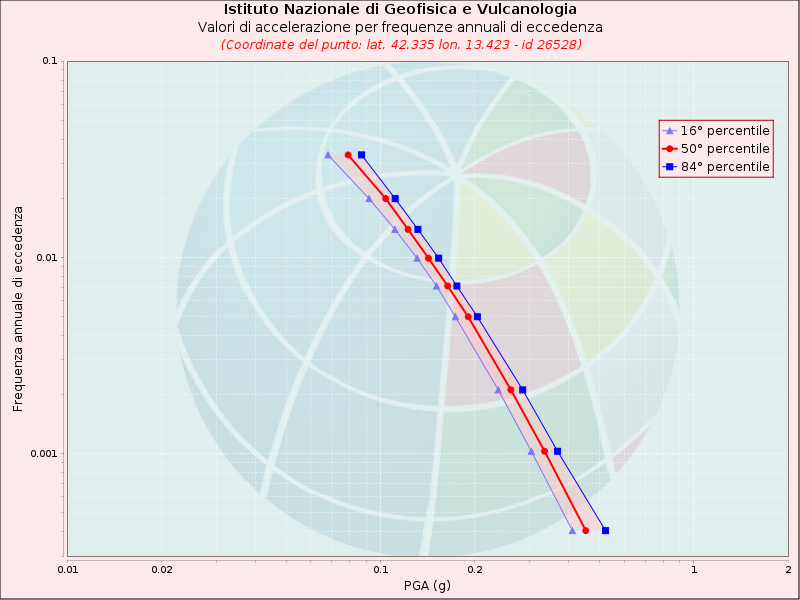 Figure 2 – Hazard curve for a selected site, showing the annual frequency of exceedance for different PGA values.
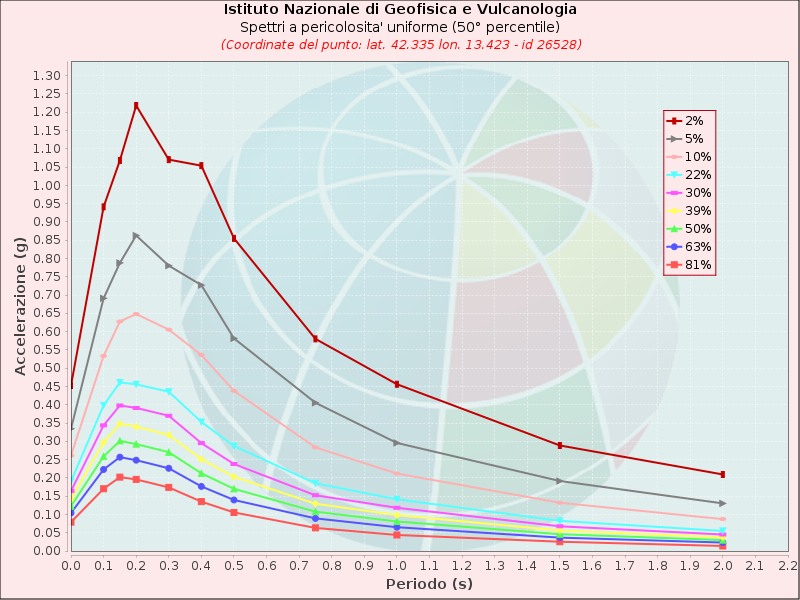 Figure 3 – Uniform hazard spectrum for a selected site, showing the expected acceleration values for different spectral periods and various probabilities of exceedance in 50 years.
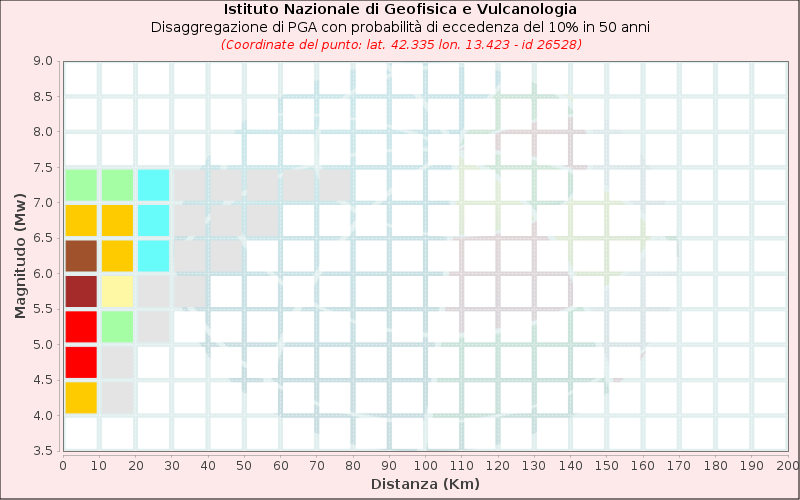
 Figure 4 – Disaggregation plot for a selected site, showing the percentage contribution to the site hazard from different combinations of magnitude and source-to-site distance.